Signal List Generated Using the OSCOR Green Spectrum Analyze Masking Function
Screenshot of the Masking function in use on the OSCOR Green. Here we can see a list of suspect signals in the middle with detailed information providing a better understanding of unusual signals in the area.

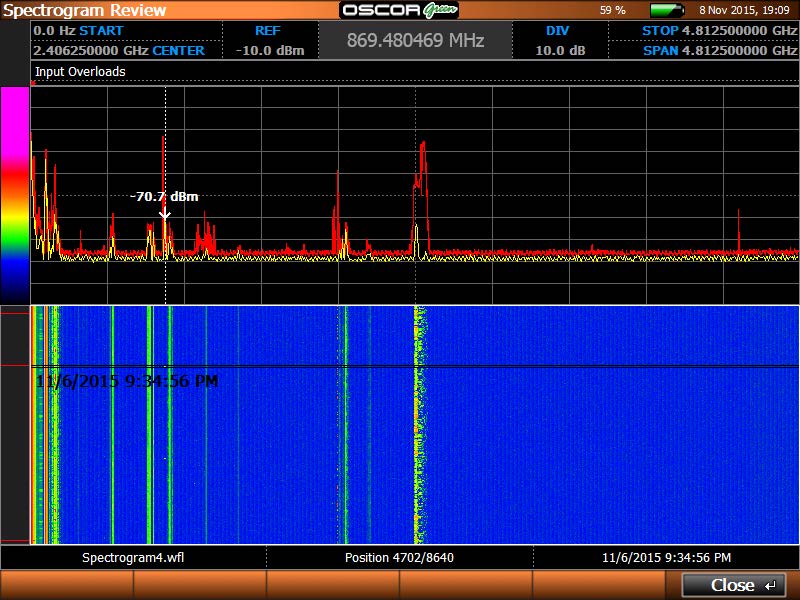
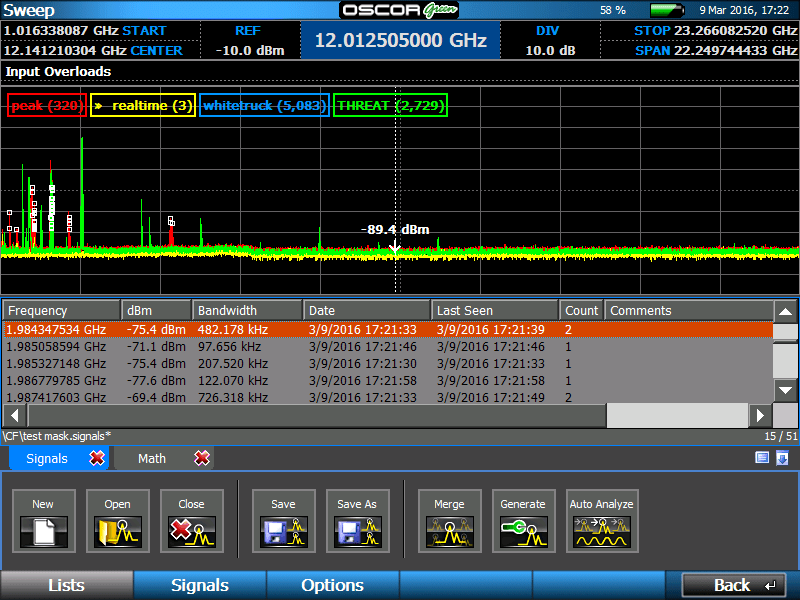
When extended capture and analysis of RF traffic is required, it can be tedious to analyze large volumes of resulting data. The Spectrogram Waterfall function on the OSCOR is an effective tool for visually inspecting RF energy over time. However, the Masking function may be an alternative starting point to help perform signal data analysis more efficiently.

Continue reading “OSCOR™ Spectrum Analyzer Masking Feature”

OSCOR Green Spectrogram Review screenshot
Figure A – Spectrogram Review screenshot illustrating a 6 GHz trace capture
(zoomed to a 4.8 GHz span) over a 24 hour period.

The OSCOR line of spectrum analyzers displays signal activity over time in a type of graph known as a waterfall display. It’s called a waterfall because of the continuous flow of rainbow colors that cascade down the screen as signal activity builds over time.

Continue reading “Upcoming OSCOR™ Feature Updates”