ORION NLJD
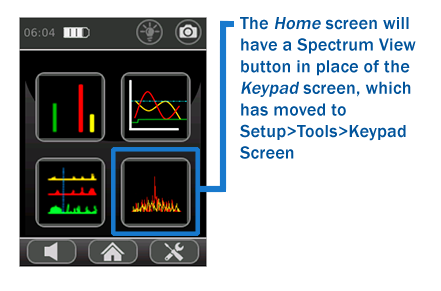
ORION Home screen keypad option has been replaced by a spectrum view screenThe ORION Non-Linear Junction Detector has a new firmware release for keypad and HX (touchscreen) ORION 2.4, ORION 900, and ORION HX Deluxe models.

The update is available as a free download on the REI website. Firmware and installation instructions for keypad models and HX (touchscreen) models are different; so it is important to choose the correct model update. Continue reading “New ORION Firmware Adds Feature And Function”
Recently a new OSCOR Firmware update was released on the REI website. This free download is available for the OSCOR Blue and OSCOR Green Spectrum Analyzers. In addition to performance  improvements, two file and data operations have been added to the latest firmware.

Frequency Allocation Information

When generating a signal list, the OSCOR will automatically populate the comments field with information about the frequency band that a signal might be a part of for the currently selected ITU  region. This information contains known regulatory or other uses of given frequency bands. Depending on the frequency there may be multiple allocations given. The frequency allocation information is also provided anytime that a signal is added to an existing signal list.

Continue reading “New OSCOR Firmware Update Available”

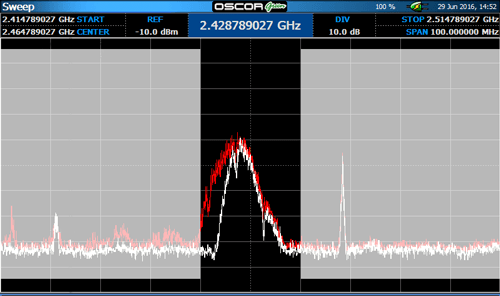
20 MHz span on OSCOR Green Spectrum Analyzer Showing WiFi Signal

When comparing spectrum analyzers, it has become common to reference a 100% Probability of Intercept (POI) specification. POI refers to the minimum transmitter pulse duration that can be detected with a 100% Probability of Intercept. When looking at these types of specifications, it is very important to understand the assumptions behind the claims and how they are calculated; with POI, it is essential to understand the span at which the POI spec is calculated.

Continue reading “Probability of Intercept Feature”

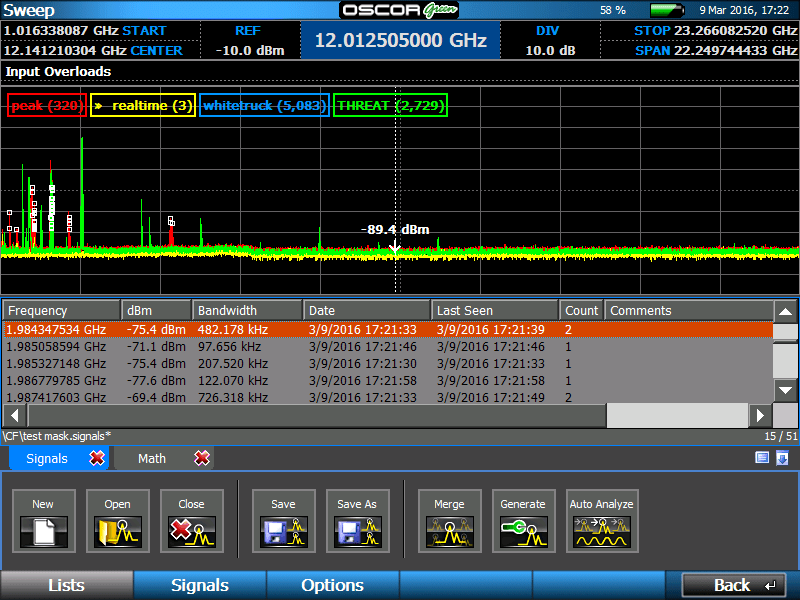
Signal List Generated Using the OSCOR Green Spectrum Analyze Masking Function
Screenshot of the Masking function in use on the OSCOR Green. Here we can see a list of suspect signals in the middle with detailed information providing a better understanding of unusual signals in the area.

When extended capture and analysis of RF traffic is required, it can be tedious to analyze large volumes of resulting data. The Spectrogram Waterfall function on the OSCOR is an effective tool for visually inspecting RF energy over time. However, the Masking function may be an alternative starting point to help perform signal data analysis more efficiently.

Continue reading “OSCOR™ Spectrum Analyzer Masking Feature”

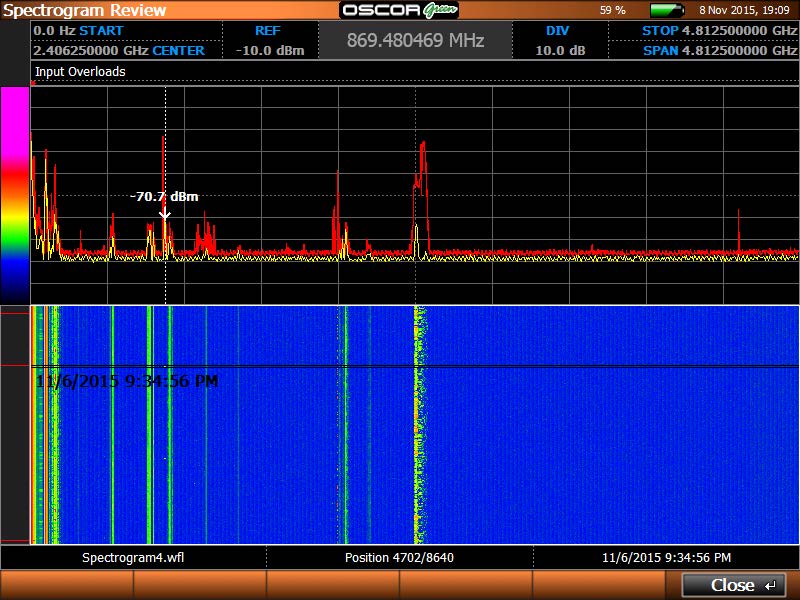
OSCOR Green Spectrogram Review screenshot
Figure A – Spectrogram Review screenshot illustrating a 6 GHz trace capture
(zoomed to a 4.8 GHz span) over a 24 hour period.

The OSCOR line of spectrum analyzers displays signal activity over time in a type of graph known as a waterfall display. It’s called a waterfall because of the continuous flow of rainbow colors that cascade down the screen as signal activity builds over time.

Continue reading “Upcoming OSCOR™ Feature Updates”