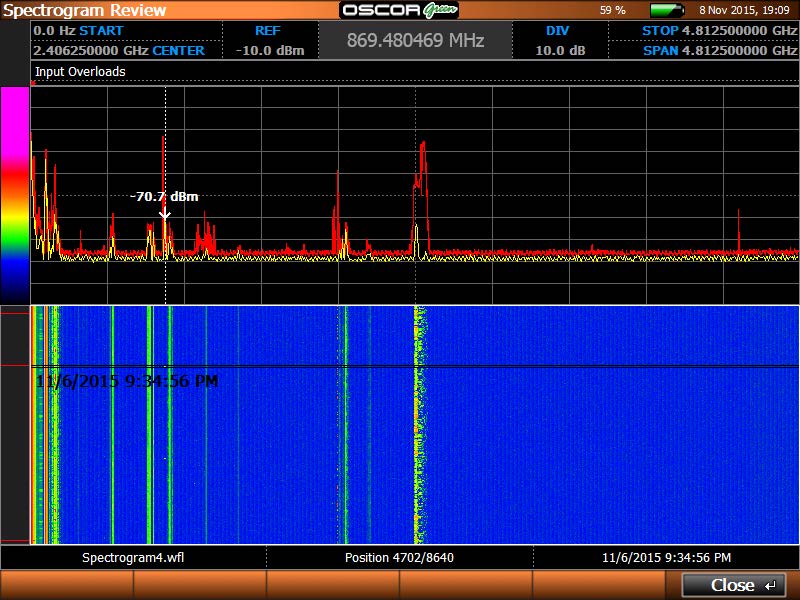
(zoomed to a 4.8 GHz span) over a 24 hour period.
The OSCOR line of spectrum analyzers displays signal activity over time in a type of graph known as a waterfall display. It’s called a waterfall because of the continuous flow of rainbow colors that cascade down the screen as signal activity builds over time.
Both the OSCOR Green and OSCOR Blue have a Live Raster function that displays activity in a short term raster waterfall.
Save Long-term Waterfall Data
Until now, the OSCOR Green was not able to preserve the data from which the waterfall was drawn. The only way to recall a waterfall for reporting or review was to save a Live Raster Waterfall bitmap image file.
REI has released an OSCOR Green firmware update that includes an important new waterfall function called Spectrogram. This new feature collects signal data and saves it in a Spectrogram waterfall file that the OSCOR Green can recall and review on-screen.
The new OSCOR Green Spectrogram Waterfall is different from the Live Raster Waterfall in that it is designed to capture traces over a long period of time (meaning hours or days) and display them in a waterfall format.
Spectrogram builds an intermediate peak trace over a user defined frequency span and time interval; and repeatedly stores these intermediate peak traces for waterfall analysis. The intermediate peak trace is “zeroed” between each time interval.
The traces are stored in a proprietary binary format at a minimum of 10 second intervals and a spectrum resolution of 24.4 kHz. These parameters were specifically chosen to provide adequate time and frequency resolution for detecting threats without creating a burdensome file size.
Spectrogram will indicate if the USB storage device (thumb drive, external hard drive, Compact Flash) has capacity to store the file. Adjusting the frequency range, interval, and duration parameters will affect the file size.
Also, a PC Data Viewer application will be provided for off-line analysis of large Spectrogram files.
Figures A and B show signals that could potentially reference a GSM cell phone or bugging device that was detected after hours at a time when no cell phone traffic should have been present in a secure conference room environment.
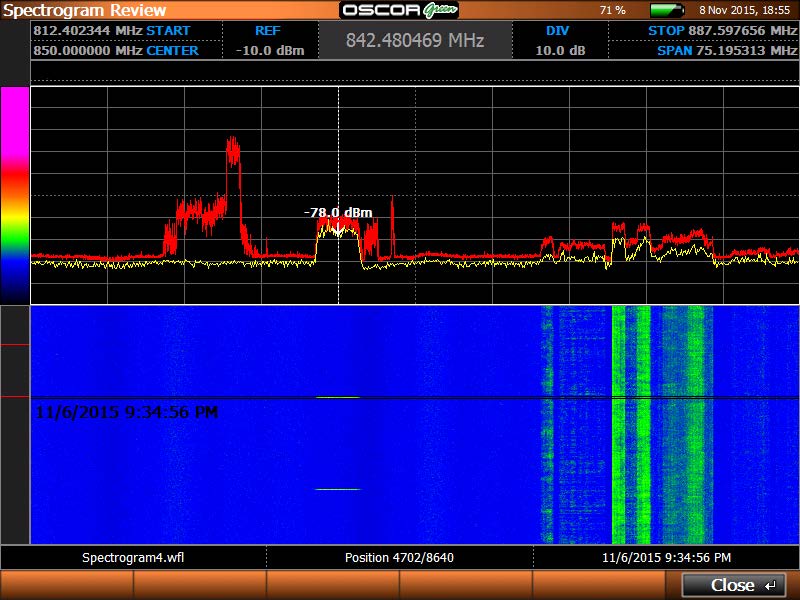
In the zoomed view of the same signal, the user can scroll up and down through the waterfall to examine the times at which transmissions occurred and for how long. In the same zoomed in span, the user can scroll left and right on the upper spectral display to view other signals collected during the same period.
Signal Persistence
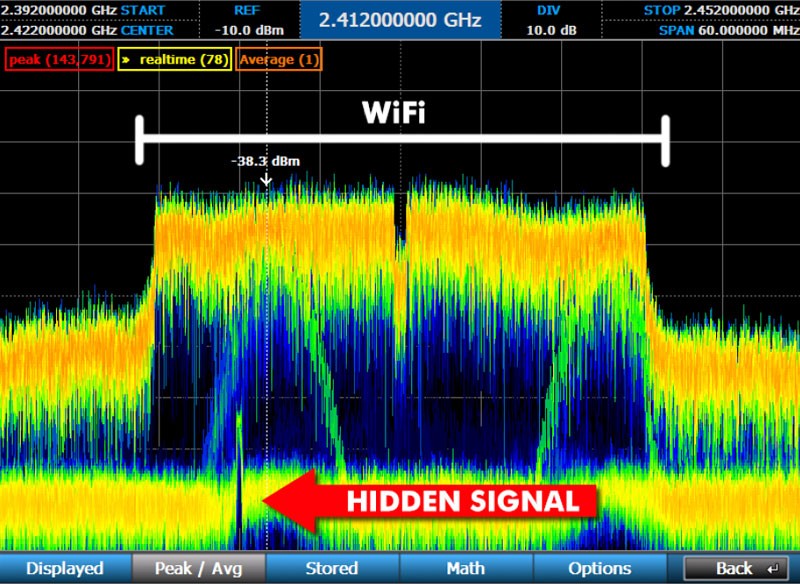
Another new feature that will be available in both the OSCOR Green and OSCOR Blue is the Persistence function. Persistence enhances the ability to recognize signals that may be hiding or masked by existing ambient environment signals. The Persistence display provides a trace graphic with a decaying color brightness based on the persistence (transmit duty cycle) of respective signals. Signals with higher transmit cycles result in brighter colors compared to signals with lower transmission rates having darker colors. Therefore, signals occupying the same frequency bands are visibly identified because of color variations associated with transmit duty cycles.
Figure C shows a signal “hiding” underneath WiFi traffic. Since WiFi transmit packets have a different transmit duty cycle, the lower power signal is easily identified in the persistence display; where as it would not be visible using normal peak trace analysis or a raster waterfall type analysis.
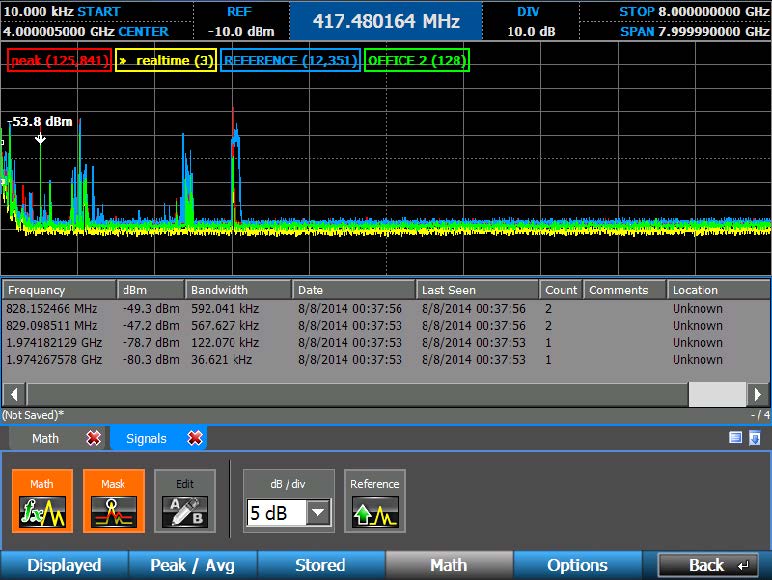
Masking Function
Another feature released in a previous firmware update is a Mask function, allowing the user to create a “mask” from a peak trace. New signals appearing above the mask threshold can be automatically added to a signal list which is shown in the screenshots in Figure D.
The new OSCOR Green firmware update is now available to download and install, free of charge, from the REI website. It comes in a compressed zip file which includes a ‘readme’ file with simple installation instructions. If you get the update, be sure to download the PDF manual that includes information on Spectrogram, Persistence and Masking.